
What is the Rule of 40 for B2B SaaS & Digital Infrastructure Companies?
What is the Rule of 40 for B2B SaaS & Digital Infrastructure Companies?
Key Takeaways
- The Core Benchmark: A healthy SaaS company’s combined revenue growth rate and profit margin should equal or exceed 40%.
- Elite Performance: Only 16% of software companies consistently exceeded this benchmark between 2011 and 2021, making it the mark of an elite operator.
- Valuation Impact: Top-quartile performers achieving the Rule of 40 generate nearly 3x higher enterprise value (EV) multiples compared to those in the bottom quartile.
- Growth vs. Profit: The metric formalizes the trade-off between growth and profitability, allowing both high-growth/low-profit and low-growth/high-profit companies to be considered healthy.
- Strategic Imperatives: Achieving this requires mastering retention (NRR >120%), maintaining strategic focus, and building an efficient growth engine.
The Rule of 40 is a financial benchmark for SaaS companies stating that the sum of the annual revenue growth rate (%) and the profit margin (%) must be at least 40% to indicate a sustainable business model.
How is the Rule of 40 Calculated?
The Rule of 40 is calculated by adding your percentage of year-over-year growth to your profit margin percentage.
While the concept is simple, the specific variables used can vary slightly depending on the company’s stage and reporting standards.
The Core Formula
The fundamental equation used by investors and executives is: {Revenue Growth Rate (%)} + {Profit Margin (%)} / 40%.
1. Revenue Growth Rate
This is typically the Year-over-Year (YoY) increase in Annual Recurring Revenue (ARR) or Monthly Recurring Revenue (MRR), expressed as a percentage.
For digital infrastructure and SaaS companies, recurring revenue is the lifeblood of the business model, making ARR/MRR growth the standard measure of top-line momentum.
2. Profit Margin
There are two common ways to measure the “profit” component of the equation:
- EBITDA Margin: This is the most common metric, calculated as Earnings Before Interest, Taxes, Depreciation, and Amortization divided by total revenue. It removes the effects of financing and accounting decisions to show core operational profitability.
- Free Cash Flow (FCF) Margin: Some investors prefer FCF margin (Cash from operations minus capital expenditures) as it represents the actual cash liquidity generated by the business.
The Trade-Off Mechanism
The power of this formula lies in its flexibility.
It mathematically formalizes the trade-off between aggressive growth and operational profitability.
- High Growth Scenario: A startup growing at 60% can afford a -20% profit margin (burning cash) and still hit the Rule of 40 ($60 + (-20) = 40).
- Mature Scenario: A mature firm growing at 10% must generate a 30% profit margin to be considered healthy.
- Note: The Rule of 40 is primarily applicable to companies that have passed the early startup stage, typically defined as having over $1 million in MRR.
Why is the Rule of 40 the “North Star” for SaaS Valuation?
Achieving the Rule of 40 is statistically correlated with significantly higher company valuations and investor demand.
In the world of B2B SaaS, the Rule of 40 serves as the ultimate arbiter of operational discipline.
It filters out companies that are “growing at all costs” without a path to profitability, as well as those that are profitable but stagnating.
The Valuation Multiplier
Data indicates a massive value creation gap between those who master the rule and those who don’t.
Top-quartile SaaS companies that consistently exceed the Rule of 40 generate nearly three times (3x) the enterprise value to revenue multiples of those in the bottom quartile.
The Difficulty of Consistency
While many companies may hit the benchmark in a single standout quarter, sustaining it is incredibly difficult. Between 2011 and 2021, only 16% of software companies consistently exceeded the Rule of 40.
This scarcity makes companies that can maintain this balance highly attractive assets.
Beyond the Single Metric
While vital, the Rule of 40 should not be the only metric used. It is a shortcut “health check” that must be contextualized with other operational metrics like Customer Acquisition Cost (CAC),
Lifetime Value (LTV) and Churn Rates. Watch below.

What are the Benchmarks for High-Performing SaaS Companies?
To understand where a company stands relative to the Rule of 40, it is necessary to compare its underlying metrics to industry standards.
High-performing (“Top Quartile”) companies operate with vastly different efficiency profiles than their peers.
Top vs. Bottom Quartile Performance
The following table contrasts the operational realities of top-quartile performers with those of bottom-quartile performers across key strategic metrics.
| Metric | Top Quartile (The Elite) | Bottom Quartile (The Laggards) | Why It Matters |
|---|---|---|---|
| ARR Growth | 45% | 14% | Measures top-line momentum and market demand. |
| Net Retention Rate (NRR) | 130% | 104% | Indicates growth efficiency from the existing customer base. |
| CAC Payback Period | <16 Months | 47 Months | The market’s valuation of the business is based on its health. |
| Free Cash Flow % | 26% | 10% | The ultimate measure of profitability and sustainability. |
| Enterprise Value Multiple | ~21x | ~9x | The market’s valuation of the business based on its health. |
The “Leaky Bucket” Danger Zone
A major reason companies fail the Rule of 40 is the “Leaky Bucket” syndrome. This occurs when a company has high median revenue (e.g., $57M) but suffers from high churn and expensive sales cycles.
- Low Loyalty: These companies struggle with low Gross Revenue Retention (GRR).
- Bloated Costs: They often have bloated Sales & Marketing and R&D spend relative to revenue.
- Strategic Drift: They frequently drift from their Ideal Customer Profile (ICP), leading to product fragmentation.
How Does Customer Retention Impact the Rule of 40?
Customer retention is the most critical lever for Rule of 40 success because it drives growth without incurring the high costs of new customer acquisition.
Net Revenue Retention (NRR)
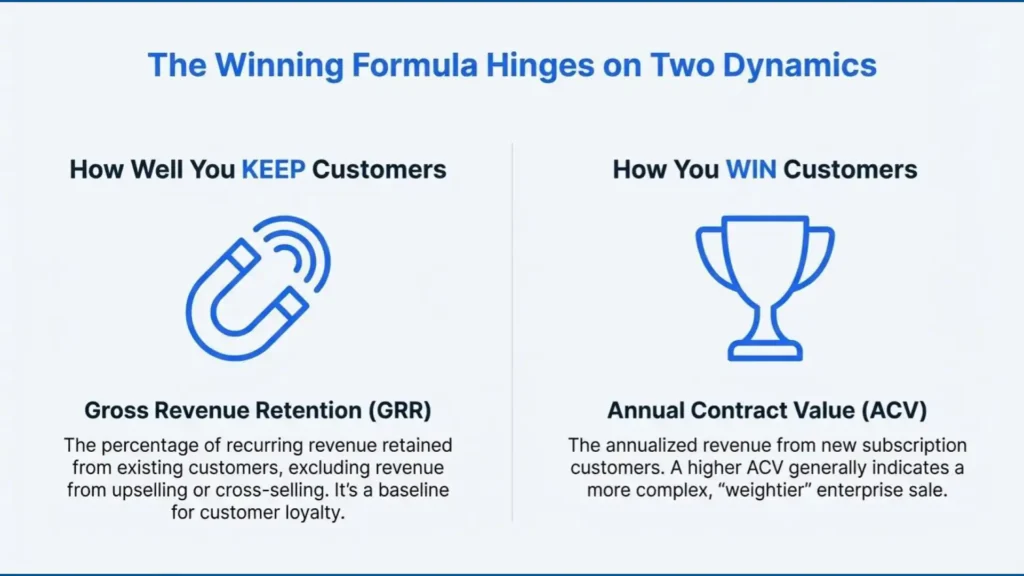
Net Revenue Retention (NRR), also known as Net Dollar Retention (NDR), measures the percentage of recurring revenue retained from existing customers, including upgrades, downgrades, and cancellations.
- The 120% Target: Companies should aim for an NRR above 120%. This implies the company can grow 20% annually without acquiring a single new customer.
- An NRR of 100% or more is the baseline for a healthy business growing from its existing base.
Gross Revenue Retention (GRR)
Gross Revenue Retention (GRR) measures retained revenue excluding upsells. It is the baseline for customer loyalty.
Clarifying ownership of renewal processes (e.g., a dedicated renewals team) can lift the median GRR by 4 percentage points.
The Churn Factor
Churn Rate is the percentage of revenue lost over a period. For mid-market companies, a good monthly churn rate is around 1-3%.
Lower churn directly improves the LTV/CAC ratio, a key efficiency indicator.
What is the Ideal CAC Payback Period by Segment?
The CAC Payback Period determines how fast a company regenerates capital to reinvest in growth; shorter payback periods are essential for cash efficiency.
The CAC Payback Period is the time (in months) it takes to recoup the cost of acquiring a customer.
While the general industry target is less than 12 months, this varies significantly by customer segment and Annual Contract Value (ACV). Unified Revenue Signal Platform: The Future of High-Velocity B2B Sales
Benchmarks by Customer Segment
| Customer Segment | Target Payback Period | ACV Context |
|---|---|---|
| SMB-Focused | < 12 Months | Lower ACV deals (<$1k) require very short paybacks (often <6 months). |
| Mid-Market | < 18 Months | Mid-range deal sizes allow for slightly longer sales cycles. |
| Enterprise | < 24 Months | High ACV (>$100k) justifies longer periods due to higher LTV and lower churn. |
- The “Sweet Spot”: High-performing SaaS companies across all segments often target a payback period of 5 to 9 months for maximum capital efficiency.
The Impact of Scale
- Startups: Early-stage companies often have longer payback periods as they invest heavily in acquiring their first customers.
- Mature Firms: Publicly traded, mature companies leverage brand and scale to achieve shorter, more efficient payback periods.
- Top Performers: The top quartile of companies achieves a payback period of <16 months, whereas the bottom quartile lags significantly at 47 months.
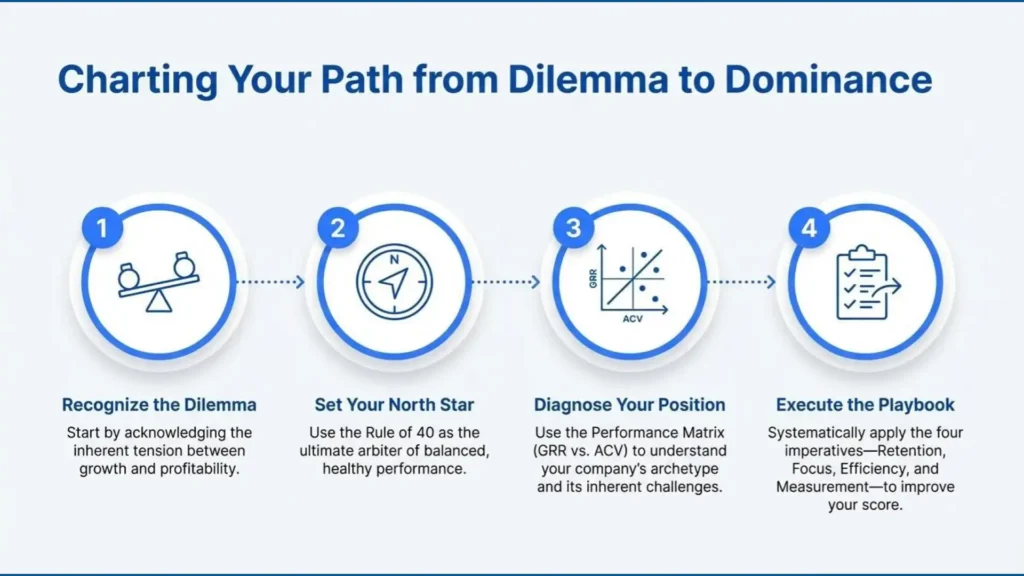
How Can Companies Execute a “Rule of 40” Turnaround?
Achieving the Rule of 40 requires a systematic playbook focused on retention, strategic focus, and efficiency.
Based on elite operator frameworks, there are four imperatives to mastering this balance:
1. Master Retention (Plug the Leaks)
You cannot fill a leaky bucket. Companies must prioritize Gross Revenue Retention (GRR) and Net Revenue Retention (NRR) before aggressively scaling sales.
- Action: Analyze root causes of churn (pricing, product gaps) and focus on rapid time-to-value during onboarding.
2. Maintain Strategic Focus
“Leaky Bucket” companies often suffer from strategic drift, moving into adjacent markets before dominating their core.
- Action: Define your Ideal Customer Profile (ICP) rigorously. Avoid premature platform plays that fragment your product and engineering resources.
3. Build an Efficient Growth Engine
Growth must be scalable, not just rapid.
This involves optimizing the LTV/CAC ratio (aiming for 3:1) and managing the Burn Multiple.
- Burn Multiple Benchmark: A burn multiple of less than 1.0x is outstanding; anything under 2.0x is considered good.
- Sales Efficiency: Ensure demand generation is not the bottleneck before adding sales heads. The sweet spot for sales quotas is 4x to 6x the account executive’s on-target earnings. Unified Commercial Data Integration with PrescientIQ: A Strategic Framework for Intelligent Growth
4. Measure What Matters
Run the business using a dashboard that correlates with enterprise value.
- Dashboard Essentials: ARR Growth, NRR, CAC Payback, and Free Cash Flow %.
Conclusion
The Rule of 40 stands as the quintessential benchmark for evaluating the holistic health and sustainable valuation of B2B SaaS and Digital Infrastructure companies.
It is far more than a simple calculation; it is a financial philosophy that dictates the necessary balance between aggressive market capture and operational discipline.
Companies that consistently exceed this 40% threshold—the true elite—are rewarded with significantly higher enterprise value multiples because they demonstrate a rare, scalable ability to generate high growth efficiently.
Ultimately, achieving the Rule of 40 is a strategic imperative rooted in mastering fundamental metrics.
It demands an unwavering focus on customer retention (NRR > 120%), disciplined capital efficiency (low CAC payback), and a clear, non-fragmented Ideal Customer Profile.
By committing to this balanced approach, companies transition from simply chasing growth to building durable, highly valuable enterprises capable of sustained success. At PrescientIQ, security, governance, and legal compliance are top of mind.
The Rule of 40 is not the end goal, but the North Star guiding SaaS leadership toward financial excellence. Domain-Specific Marketing Agents: The Missing Link in B2B Developer Sales